Fibonacci Retracements Analysis 20.01.2022 (Brent, Dow Jones)
Brent
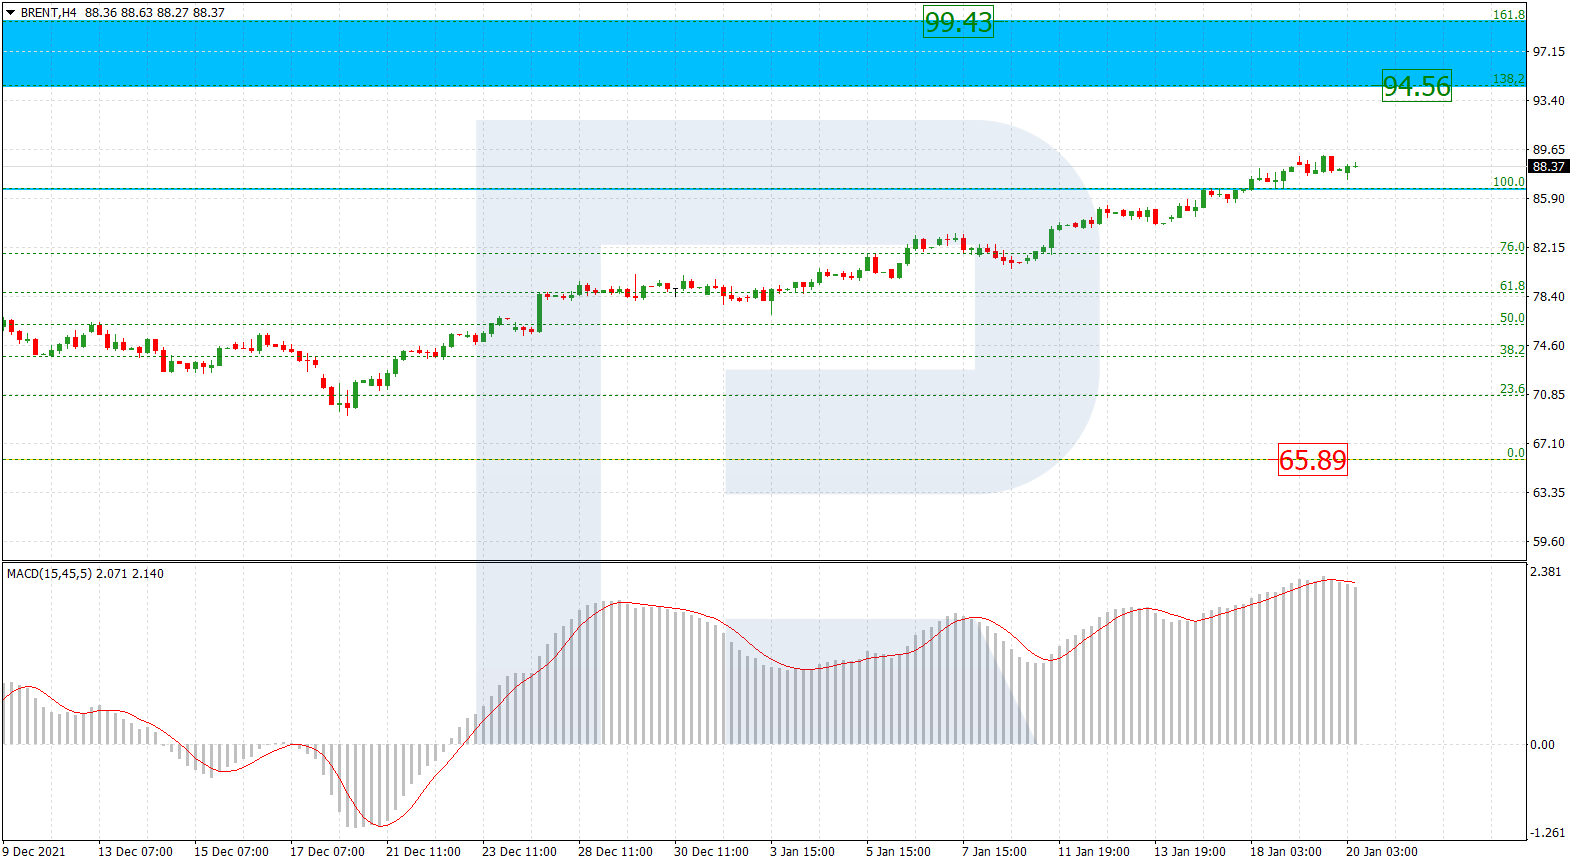
As we can see in the H4 chart, Brent has broken its previous high at 86.63. Right now, the asset is trying to fix above it and continue trading upwards to reach the post-correctional extension area between 138.2% and 161.8% fibo at 94.56 and 99.43 respectively. The key support is the low at 65.89.

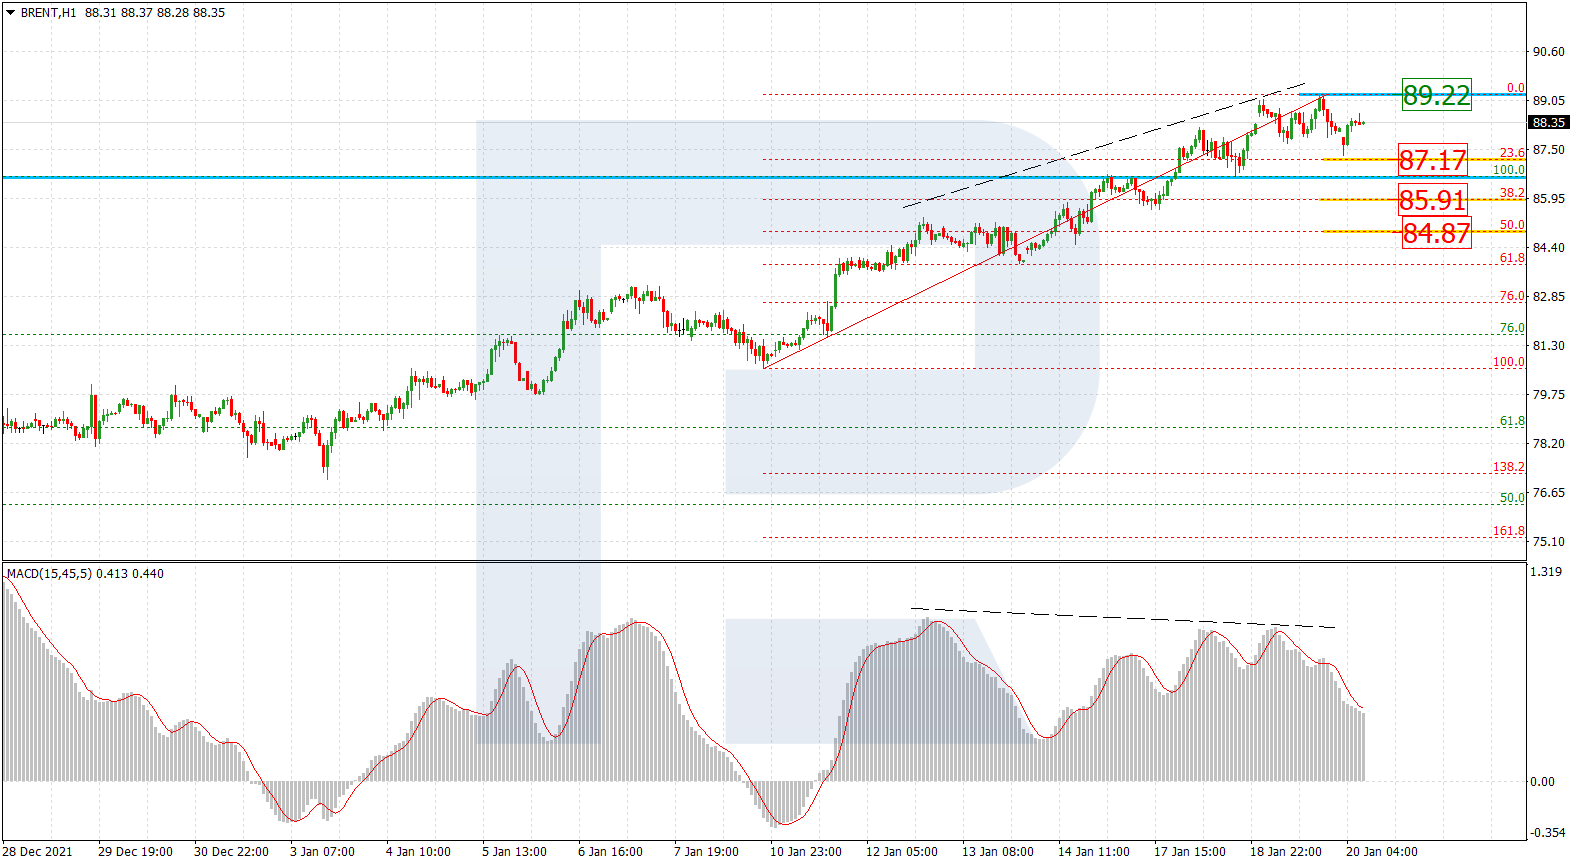
The H1 chart shows the potential short-term downside correctional targets after divergence on MACD; they are 23.6%, 38.2%, and 50.0% fibo at 87.17, 85.91, and 84.87 respectively. The local resistance is at 89.22; if the price breaks it, the uptrend may continue.
Dow Jones
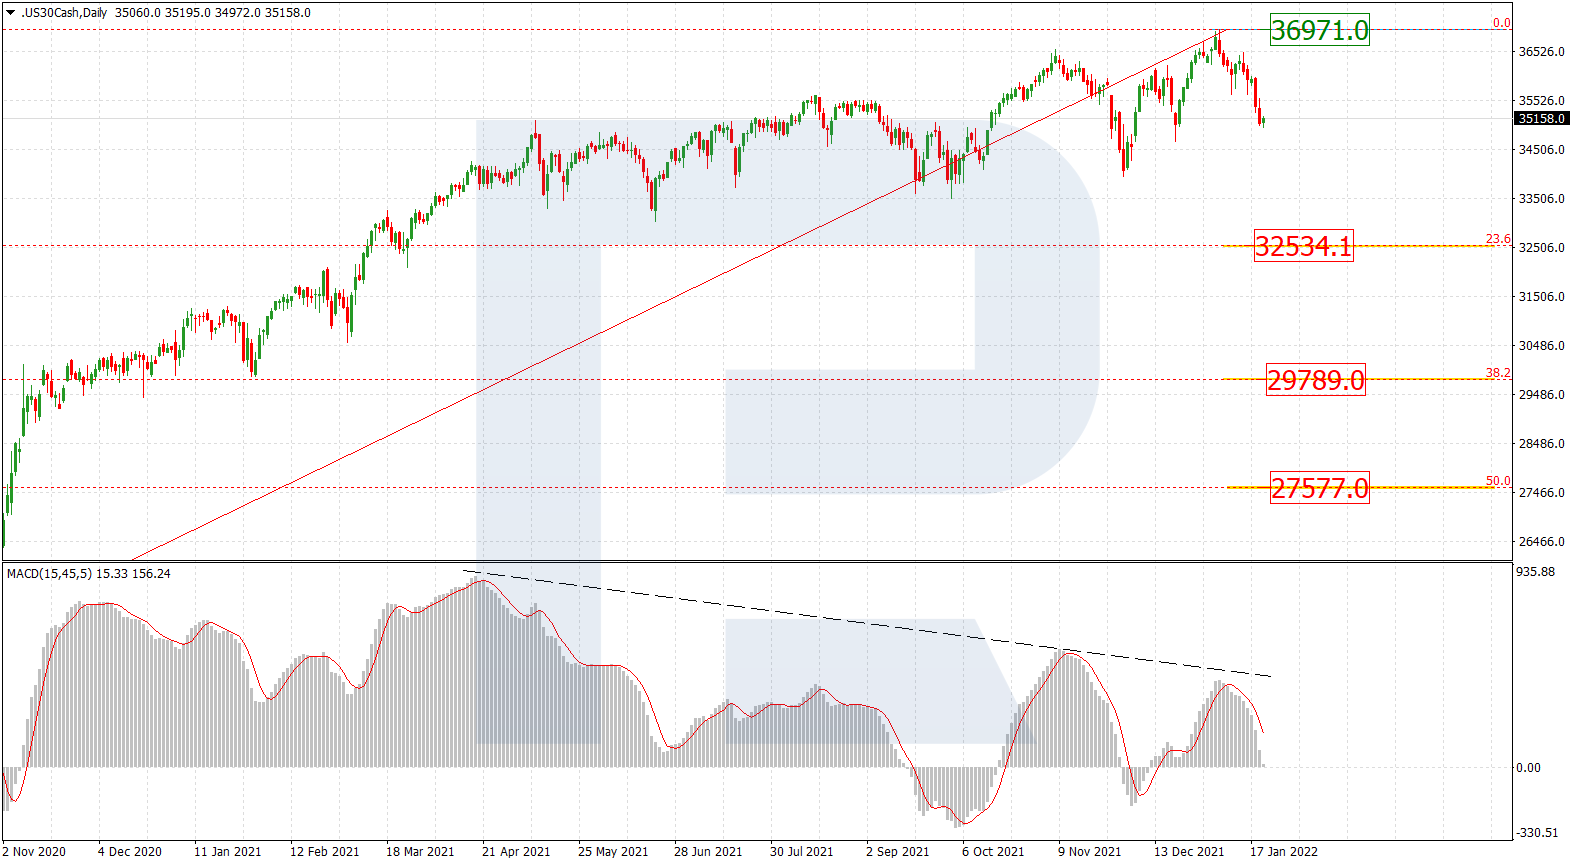
As we can see in the daily chart, the asset is falling after divergence on MACD. The closest downside targets are 23.6%, 38.2%, and 50.0% fibo at 32534.1, 29789.0, and 27577.0 respectively. The key resistance is the high at 36971.0.
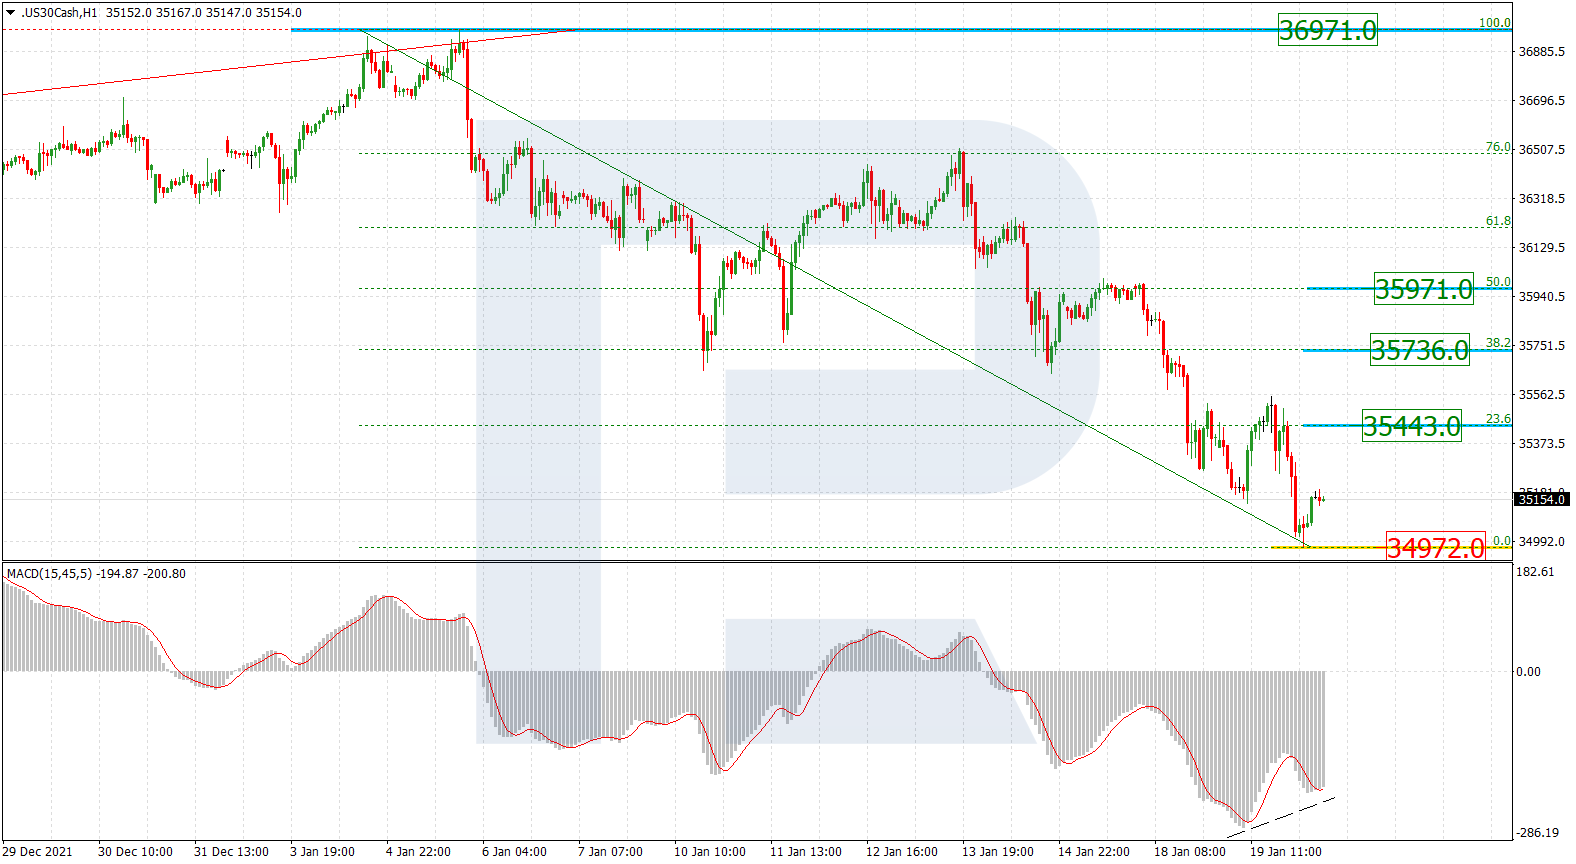
The H1 chart shows convergence on MACD, which may hint at a possible pullback towards 23.6%, 38.2%, and 50.0% fibo at 35443.0, 35736.0, and 35971.0 respectively. The support is the low at 34972.0.
Forecasts presented in this section only reflect the author’s private opinion and should not be considered as guidance for trading. RoboForex bears no responsibility for trading results based on trading recommendations described in these analytical reviews.