Forex Technical Analysis 2012/10/01 (EUR/USD, USD/CHF, AUD/USD, USD/CAD) Forecast FX
09.01.2012
Forecast for January 10th, 2012
EUR/USD
Although the EUR/USD currency pair has reached a new local minimum, it hasn’t broken the support line at the RSI. The closest target of the growth is the area of 1.2860. There, one can consider either selling the pair at this level, or wait until the price leaves the descending channel and then start opening long positions. At the moment one can consider buying the pair with the tight stop.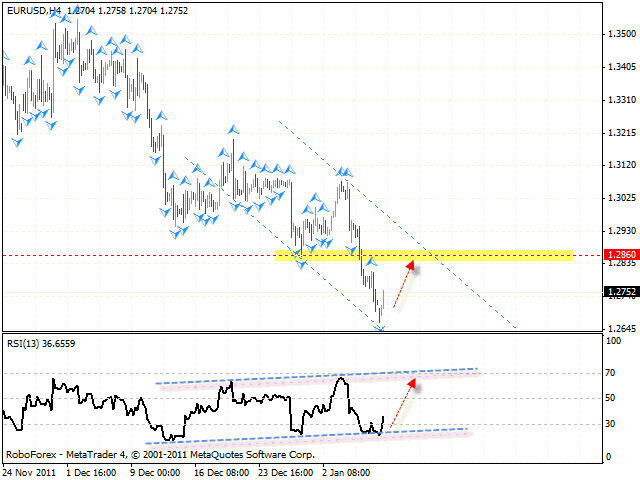
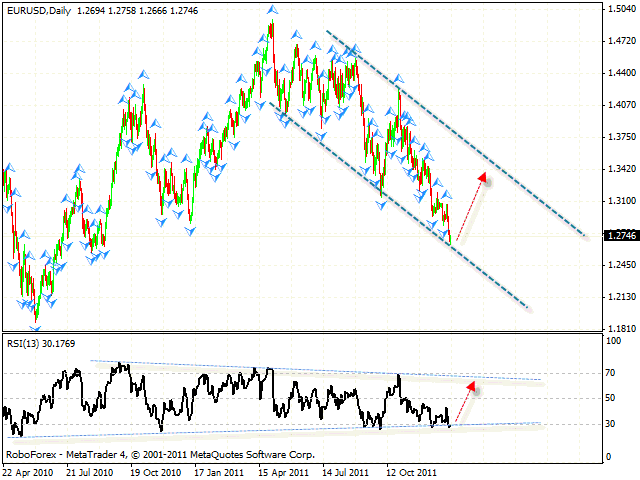
At the daily chart the pair is still testing the trend’s rising line at the RSI, we should expect it to rebound from the line and start moving upwards. Then the price may try to test the descending channel’s upper border. The closest resistance level is the trend’s descending line at the RSI.
USD/CHF
The daily chart of the USD/CHF currency pair hasn’t changed much. Here at the RSI we have “failure swing” reversal pattern forming with the target in the area of 0.9310. One can consider selling the pair if reversal patterns are formed at shorter timeframes. If the RSI indicator grows higher than 70, this case scenario will be cancelled.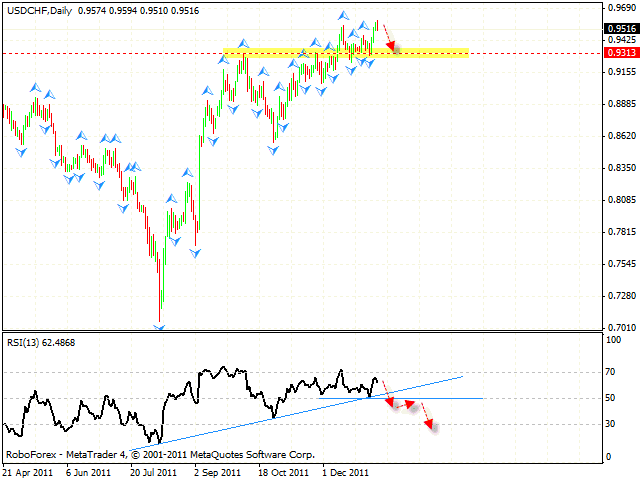
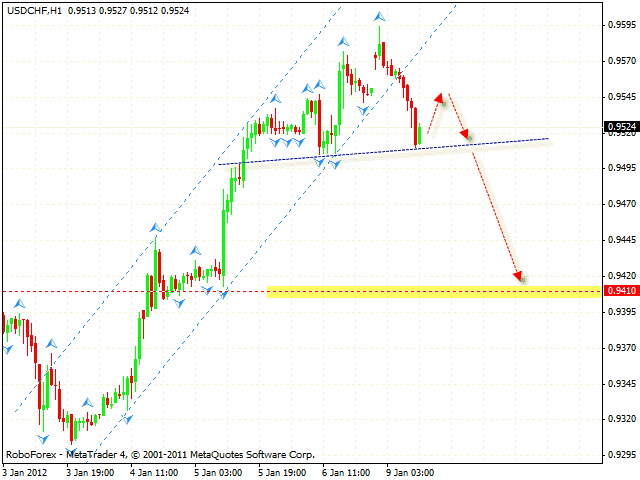
At the H1 chart of Franc we have “head & shoulders” reversal pattern forming with target in the area of 0.9410. Currently we should expect the price to form “right shoulder”. One can consider selling the pair aggressively near the level of 0.9545 with the stop placed above 0.9570, and increase the amount of short positions only after the price breaks the level of 0.9510.
AUD/USD
Australian Dollar continues moving inside “triangle” pattern. The RSI indicator was supported by the trend’s rising line, we should expect it to rebound from the line and test the pattern’s upper border, and there is a possibility that it may break the pattern upwards. The target of the growth is the level of 1.0785.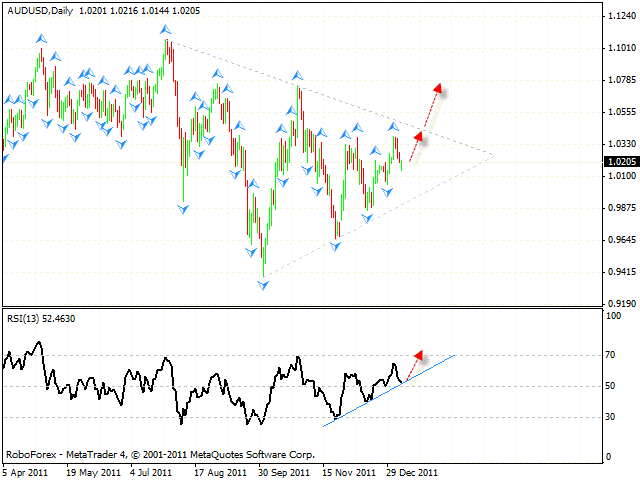
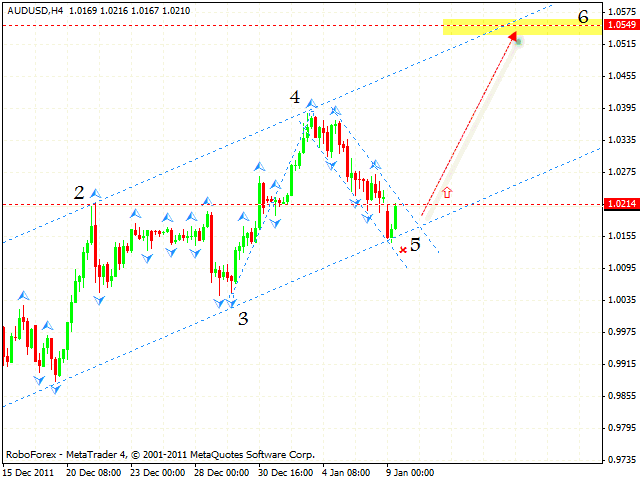
At the H4 chart the price continues forming the rising symmetrical pattern with the target in the area of 1.0549. Currently the pair is testing the rising channel’s lower border, one can try to buy it with the tight stop. If the price breaks the level of 1.0155, this case scenario will be cancelled.
USD/CAD
At the daily chart Canadian Dollar is also moving inside “triangle” pattern. Judging by the structure of the price movement at the H4 chart, we should expect the test of the support level in the area of 1.0085. One can consider selling the pair with the tight stop. The test of the resistance line at the RSI is an additional signal to sell the pair.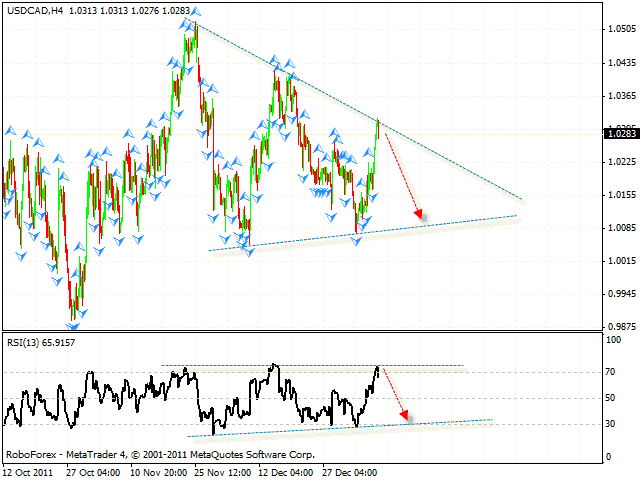
Attention!
Forecasts presented in this section only reflect the author’s private opinion and should not be considered as guidance for trading. RoboForex bears no responsibility for trading results based on trading recommendations described in these analytical reviews.