Wave Analysis 27.01.2014 (DJIA Index, Crude Oil)
27.01.2014
Analysis for January 27th, 2014
DJIA Index
Index continues falling down. Probably, wave 2 is taking the form of flat pattern with bearish impulse [C] inside it. In the nearest future, instrument is expected to fall down a little bit inside wave (3), that’s why I opened sell order during correction.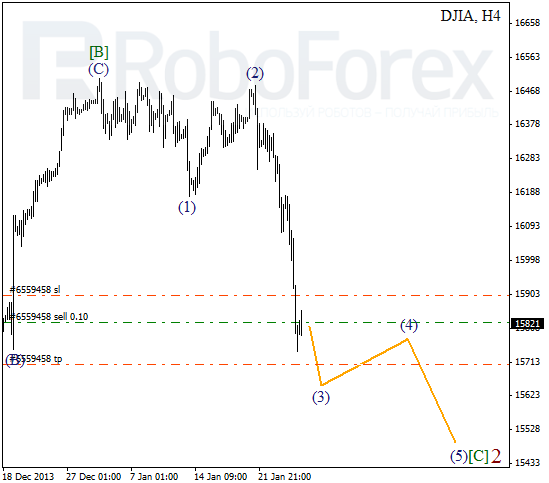
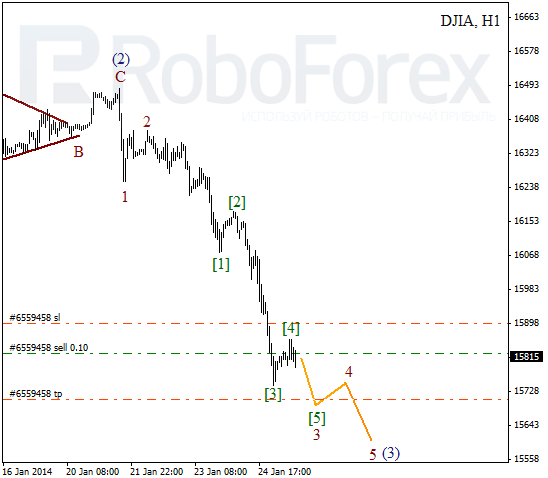
More detailed wave structure is shown on H1 chart. Probably, Index is forming extension inside wave 3. On minor wave level, price is finishing the fourth wave. Most likely, in the nearest future instrument may break minimum of wave [3].
Crude Oil
It looks like Oil completed wave (2). Earlier, after completing zigzag pattern inside wave [B], price formed bearish impulse inside wave (1). Right now, I’m selling very carefully, but after instrument forms initial descending impulse I’ll increase my short position.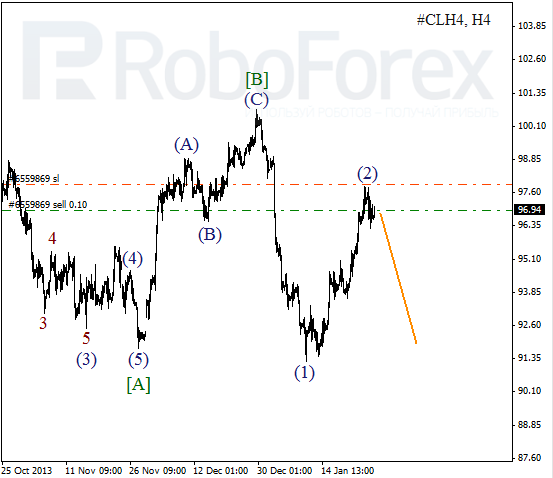
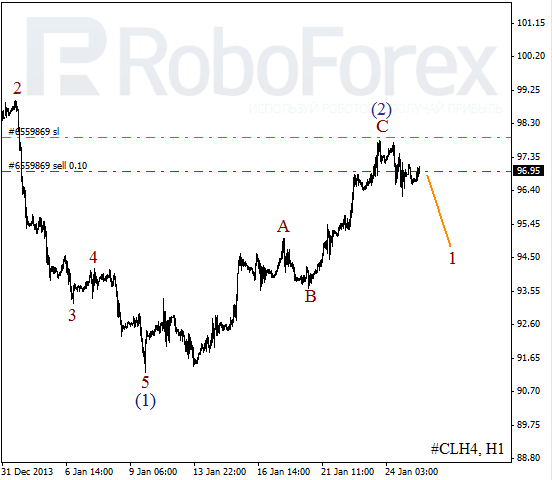
As we can see at the H1 chart, wave (2) took the form of zigzag pattern. On minor wave level, price formed wedge pattern inside wave 1. In the future, instrument is expected to continue falling down.
RoboForex Analytical Department
Attention!
Forecasts presented in this section only reflect the author’s private opinion and should not be considered as guidance for trading. RoboForex bears no responsibility for trading results based on trading recommendations described in these analytical reviews.