Wave Analysis 21.02.2013 (DJIA Index, Crude Oil)
21.02.2013
Analysis for February 21st, 2013
DJIA Index
It looks like a descending impulse, which was formed yesterday, may stop the Index from moving upwards. In any case, the structure of wave 5 of (1) implies that this impulse has been already completed. We can’t exclude a possibility that after a local correction the price may start a new descending movement.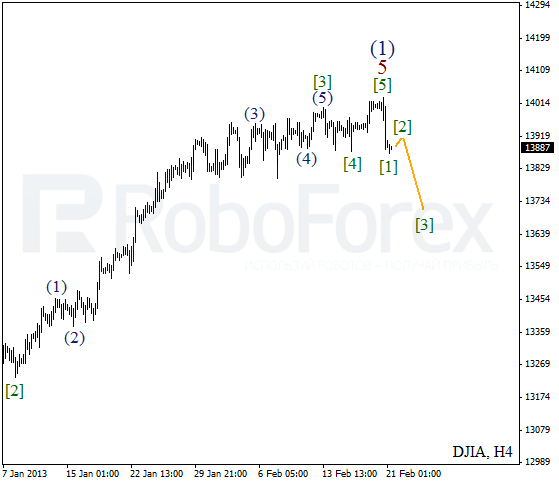
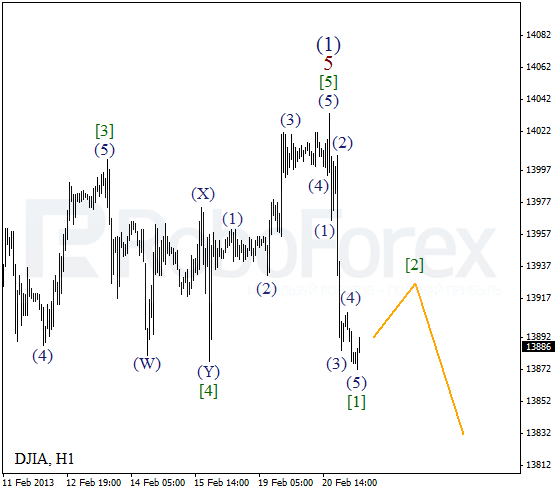
More detailed wave structure is shown on the H1 chart. The price formed a descending impulse inside wave (1). During the day the instrument may start a correction, but it is unlikely to be a very serious one.
Crude Oil
We may assume that the price completed an impulse inside wave C. On the minor wave level the instrument finished divergent wedge pattern inside the first wave. In the future we can expect Oil to form a correction, after which the bears may start a new descending movement.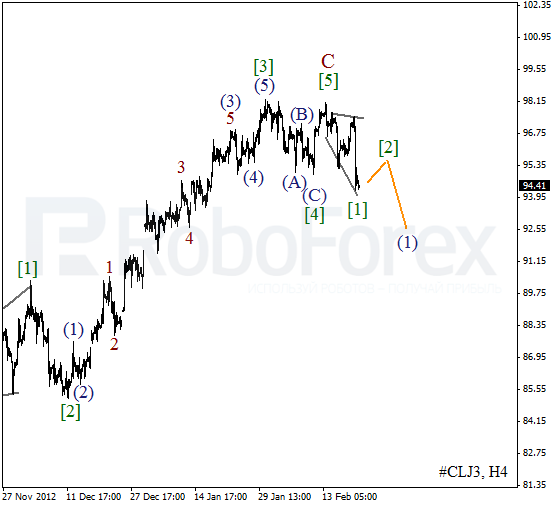
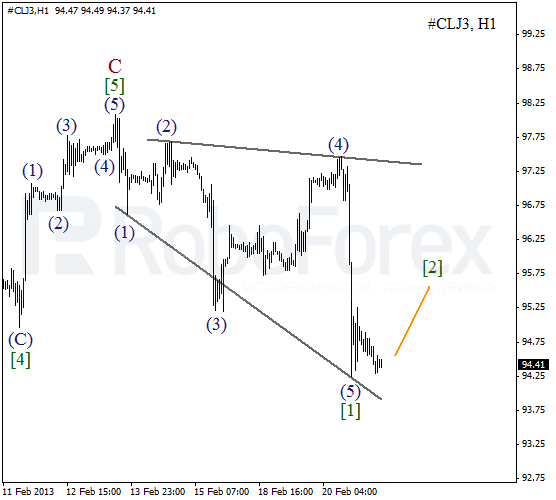
As we can see at the H1 chart, Oil formed the fifth wave inside wedge pattern. Currently the price is forming the second wave. After a local correction, I’ll try to find a good entry point to open a sell order.
RoboForex Analytical Department
Attention!
Forecasts presented in this section only reflect the author’s private opinion and should not be considered as guidance for trading. RoboForex bears no responsibility for trading results based on trading recommendations described in these analytical reviews.