Wave Analysis 28.02.2013 (DJIA Index, Crude Oil)
28.02.2013
Analysis for February 28th, 2013
DJIA Index
It looks like the Index is still making another reverse. We may assume that the price formed divergent horizontal triangle inside wave [4], a quite rare pattern. In the near term, the instrument is expected to continue growing up and form wave [5] of 5.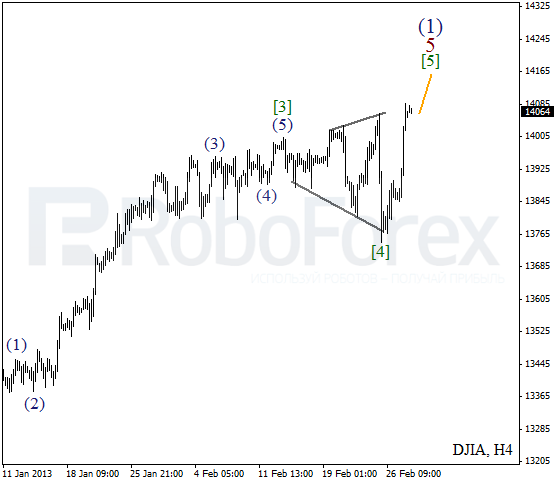
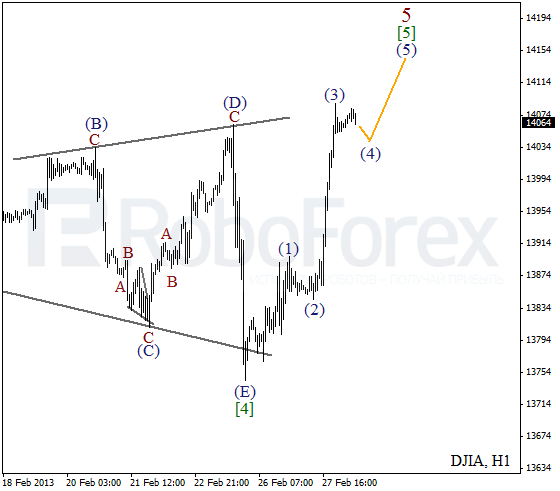
More detailed wave structure is shown on the H1 chart. Yesterday the market grew up inside the third wave and right now a local correction is taking place. Most likely, the Index will start a new ascending movement inside wave (5) during the day.
Crude Oil
Oil is still moving downwards and expanding the third wave. On the minor wave level the price is forming wave 5 of (3). We can’t exclude a possibility that during the next several hours the instrument may break a local minimum.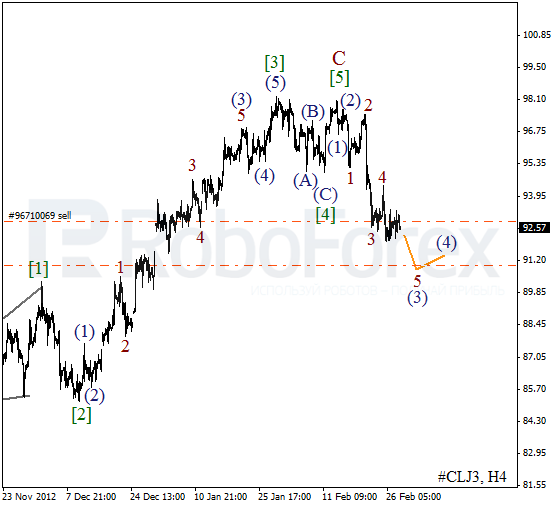
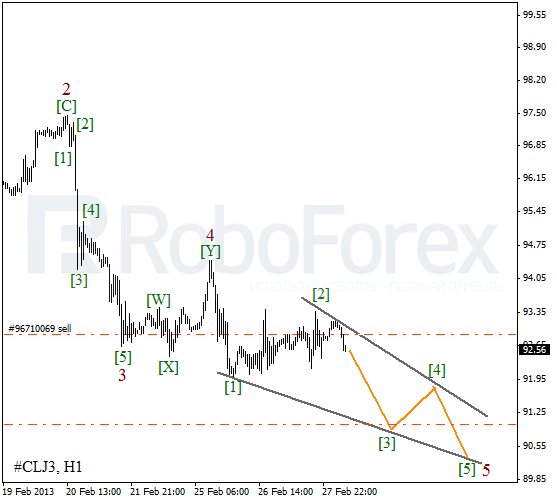
As we can see at the H1 chart, wave 5 is taking the form of diagonal triangle pattern. The price is starting to form a new short wave, the third one. Despite the fact that the forecast is bearish, I’ve already moved the stop on my order into the black.
RoboForex Analytical Department
Attention!
Forecasts presented in this section only reflect the author’s private opinion and should not be considered as guidance for trading. RoboForex bears no responsibility for trading results based on trading recommendations described in these analytical reviews.