Wave Analysis 19.03.2014 (DJIA Index, Crude Oil)
19.03.2014
Analysis for March 19th, 2014
DJIA Index
Index is still being corrected. Probably, wave [2] is taking the form of zigzag pattern with wave (B) being completed inside it. In the near term, price is expected to start falling down inside wave (C).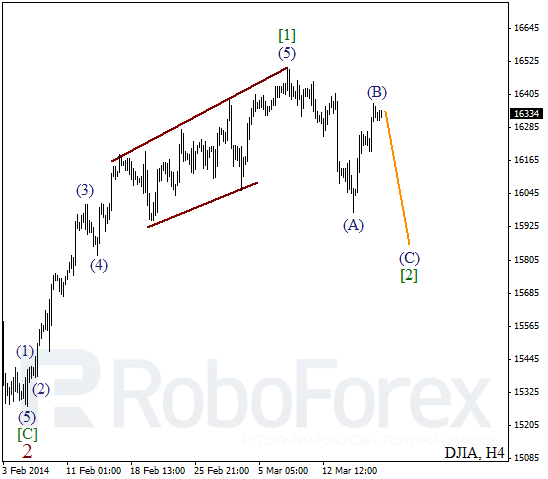
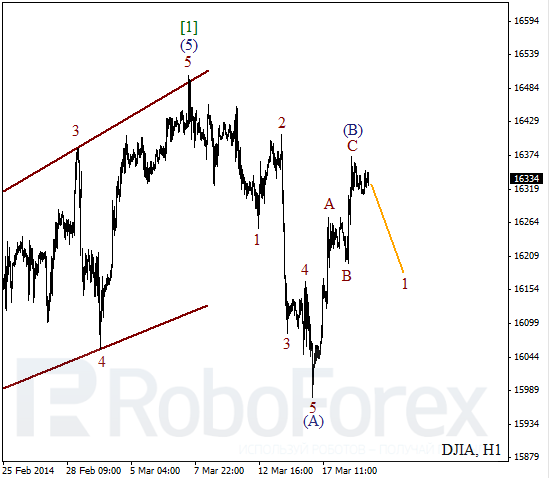
More detailed wave structure is shown on H1 chart. It looks like after completing bearish impulse inside wave (A), Index started forming ascending zigzag pattern. On minor wave level, market finished wave C of (B). During the day, instrument may start forming initial descending impulse.
Crude Oil
Yesterday Oil formed bearish impulse inside wave 1 and started correction. Most likely, the second wave will continue for the next several days. During local correction, I opened short-term buy order.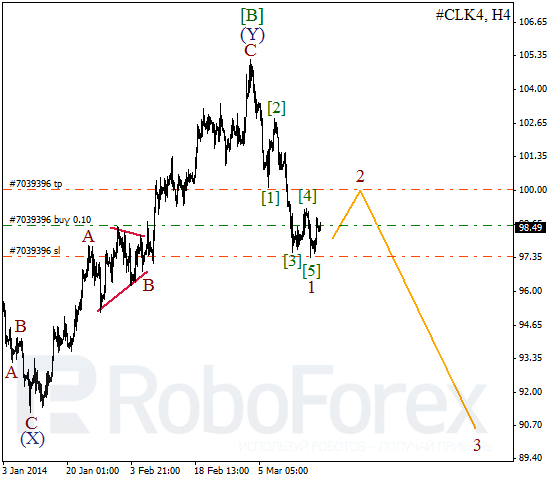
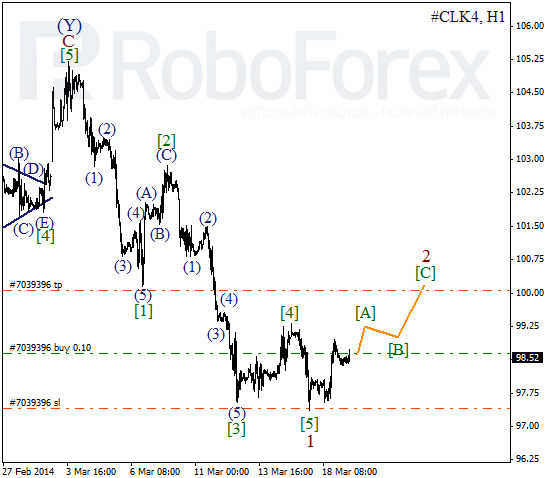
As we can see at the H1 chart, after finishing the fifth wave inside the first one, Oil started forming bullish impulse inside wave [A]. Probably, market may reach new maximum during the day.
RoboForex Analytical Department
Attention!
Forecasts presented in this section only reflect the author’s private opinion and should not be considered as guidance for trading. RoboForex bears no responsibility for trading results based on trading recommendations described in these analytical reviews.